
When you register a domain, the host offers you a one-click default: a stack that works, ships today, and quietly runs on whatever energy the grid happens to supply. We had spent months building a methodology for sustainable digital design. Standing at our own checkout, we noticed how easy it would be to ignore all of it. The website nobody briefs properly is usually the agency’s own.
TL;DR
- We wrote ourselves a client brief before building our own site: under 0.1g CO2 per visit, PageSpeed 90+ on mobile and desktop.
- Green hosting was the single decision with the widest reach: renewable energy behind every request, not an offset bought after the fact.
- A static architecture removed server-side rendering, database calls, and per-request processing, which means less energy and fewer failure points.
- Image format, font loading, and JavaScript discipline optimised what hosting and architecture left behind.
- The finished build measures 0.03g CO2 per visit on the live public site (rating A+, cleaner than 95% of pages tested), with PageSpeed 98 on mobile and 100 on desktop, all inside the brief.
The website nobody briefs properly
Agencies are good at briefs for other people. A client arrives, you set targets, you measure against them, and you hold the work to a standard before it ships. Then the agency’s own website goes up on whatever was fastest, because nobody wrote the brief. It is an easy pattern to fall into, and we were one click away from it ourselves.
So we did the obvious, slightly uncomfortable thing. We treated ourselves as a client: a written brief, two numeric targets, and a deadline. If a sustainable-design methodology is real, the first place it should show up is your own infrastructure. A sustainability agency running its front door on a default stack is not a small irony. It is the whole credibility question.
A website’s footprint is a real number
Most conversations about sustainable websites stall because the thing being discussed feels abstract. It is not. A web page has a measurable carbon cost per visit, estimated from the data it transfers, the energy that moves and renders it, and how that energy is generated. You can put a number on it in about thirty seconds.
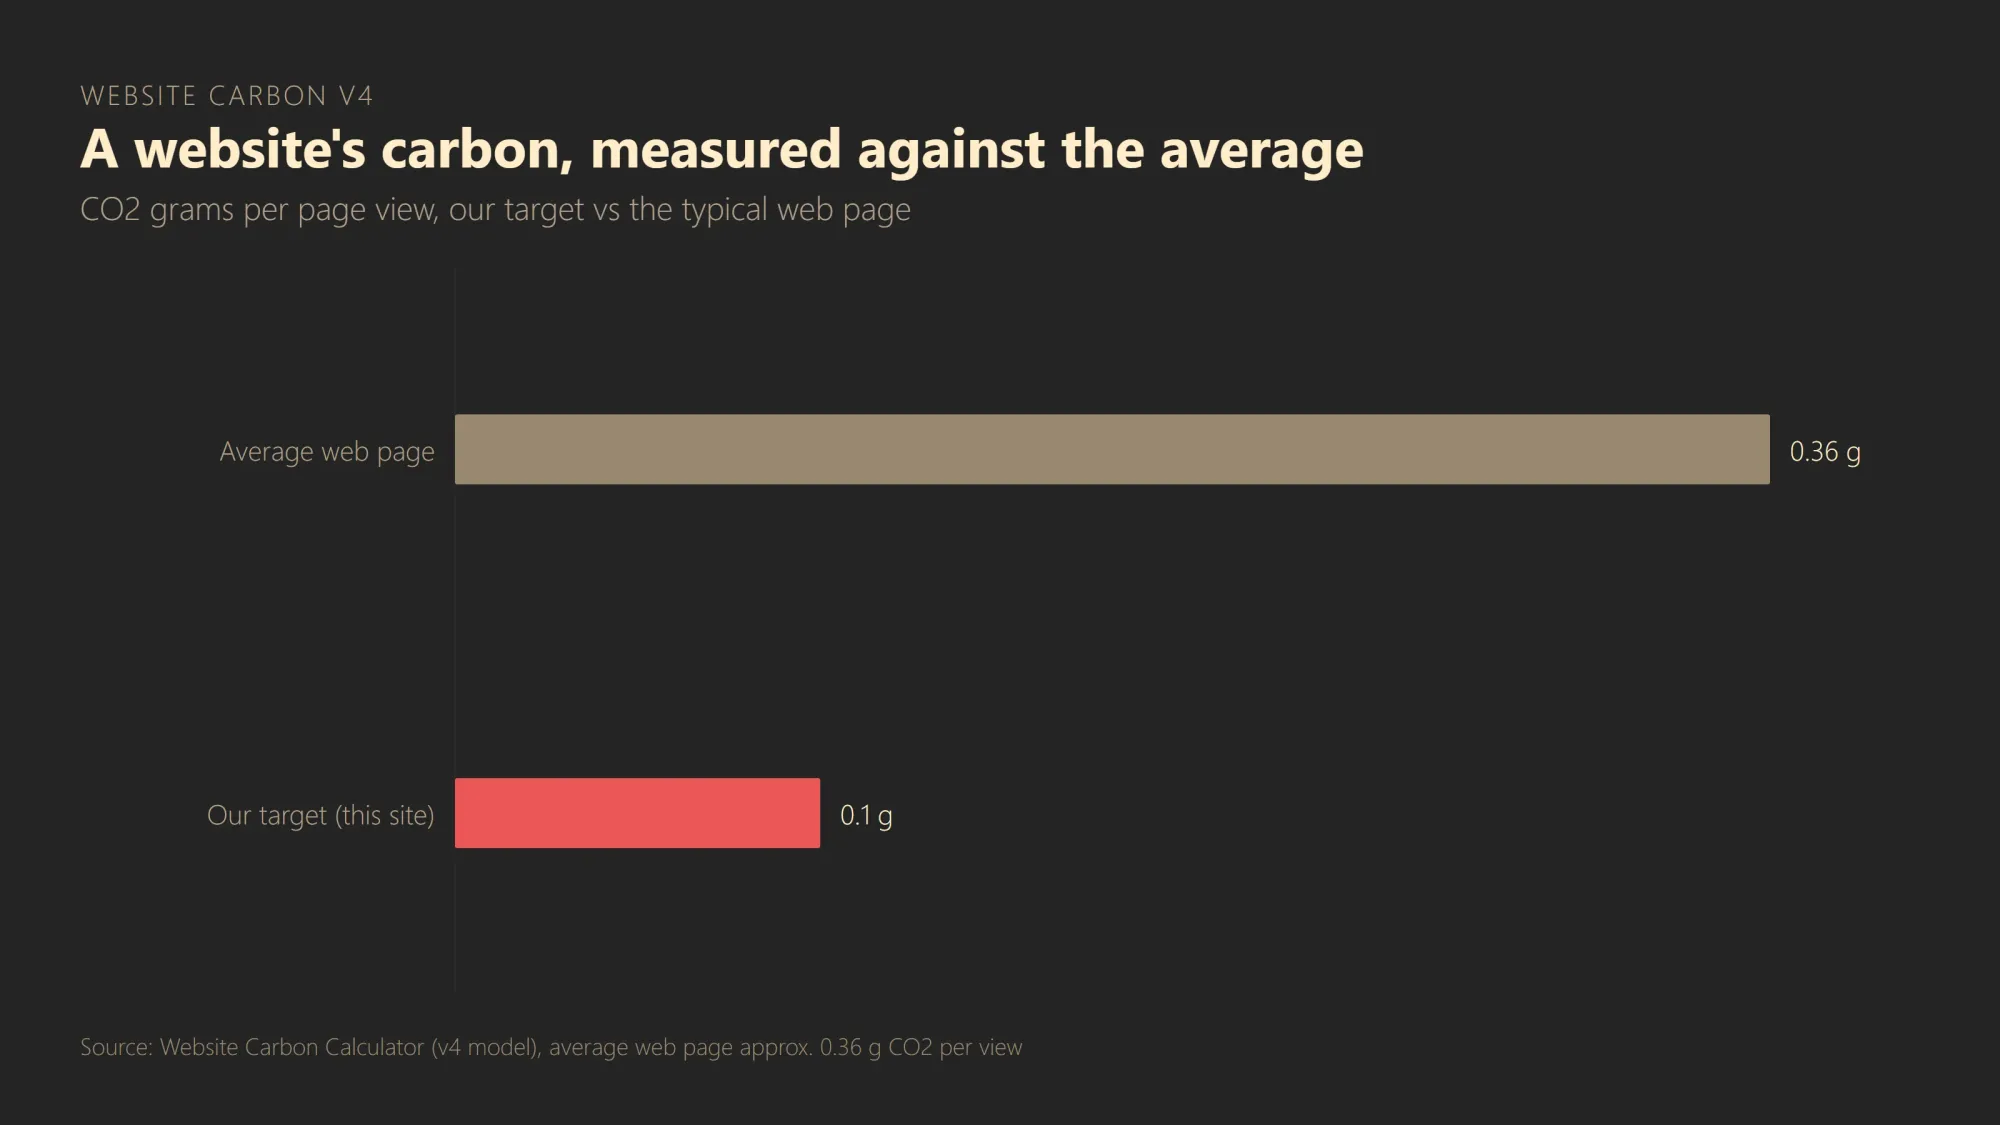
The average web page produces about 0.36g of CO2 per view, according to the Website Carbon Calculator. Most organisations have never checked theirs. Most agencies have never offered to check a client’s. That gap is both the opportunity and the accountability, because a number you can measure is a number you can be held to. “More sustainable” is a feeling. “Under 0.1g per visit, measured on this date” is a claim. We wanted the second kind. [idea: sustainable-web-design-model-explained]
The brief we set ourselves
We wrote two numbers down before touching a line of code.
The sustainability target was under 0.1g of CO2 per page visit. We picked it against an external benchmark rather than a number that flattered us. The average web page produces about 0.36g, and the most efficient sites the Website Carbon Calculator showcases sit around 0.06 to 0.09g. We wanted to be in that second group, not just below average, so we set the bar at under 0.1g: more than three times cleaner than the typical page, and within reach of the cleanest sites on the web. A looser target would have proved we could beat an average. It would not have proved we could build to the standard we actually care about.
The performance target was a PageSpeed score of 90 or above on both mobile and desktop. Ninety is the line where PageSpeed rates a page “good,” so the target sits at a meaningful threshold rather than an arbitrary one. We required mobile as well as desktop on purpose, because mobile is the harder test, and the easy cheat is to quote the desktop score and stay quiet about mobile.
Two numbers, both pinned to an external standard. That is the part that makes a target honest: you do not get to move it after you see the result.

Hosting was the decision with the widest reach
We made the hosting call first, deliberately. Of every decision in a build, the host is the one that changes the energy behind every single request at once. You can compress every image on a page and still serve it from a data centre running on fossil power. Switch to a host running on renewable supply, and you have cleaned the energy under the whole site without shipping a single byte less. Everything after that optimises what remains.
We chose Krystal. Their data centres run on 100% renewable energy, and their flagship UK facility reports a power usage effectiveness of 1.10, which means almost all of that energy reaches the servers rather than the cooling. They have been a certified B Corp (an independently audited social and environmental standard) since early 2023, and their hosting is independently verified as green by the Green Web Foundation. That independent verification is the part that matters: it is a third-party check, not a self-declared green badge. Renewable supply is also a different thing from a carbon offset bought after the fact. One keeps the emission from happening; the other pays to compensate for it once it has. We wanted the first kind. [idea: green-hosting-vs-offsets]
What going static removed
The second decision was to build the site static. A static site serves pre-built pages straight from the host. There is no server-side rendering on each request, no database query waiting to happen, and no per-visit processing assembling a page that is identical for everyone anyway.
The reasoning mattered more than the technique. Fewer moving parts means less energy per request, fewer things that can break, and a faster response, because there is nothing to compute before the page starts arriving. The constraint is real and worth naming: static makes genuinely dynamic, per-user content harder, so anything dynamic has to earn its place rather than arrive by default. For a marketing site, almost nothing needed it. [idea: static-vs-dynamic-carbon]
Optimising the remainder
Hosting and architecture set the ceiling. The rest is discipline about what each page actually ships.
Images are served as WebP, compressed to a budget, with a hard cap per file. A single unchecked hero image can outweigh the rest of a page combined, so every image had to justify its bytes. Fonts load without the blocking waterfall that holds up rendering while a webfont downloads, so text appears immediately rather than waiting on a font request. JavaScript is kept to what the page genuinely needs, not a framework shipped out of habit. Less script is less to download, less to parse, and less to run on the visitor’s device, which is where a large share of a page’s real-world energy is actually spent.
None of these are exotic moves. They are the boring decisions that compound, and most sites skip them because nobody set a budget that made them necessary.
How it actually went
Most of the build was straightforward, because the sustainable choice and the practical choice were the same choice. Static is cheaper to host and faster to serve. Lean images load quicker and cost less bandwidth. Renewable hosting was a supplier decision, not a redesign. For most of the work, constraint and sustainability pointed the same way.
They did not always agree. The original plan for the hero section included a looped video of leaves moving in a soft wind, the kind of detail that makes a site feel alive. A short looped clip, even well-compressed, typically runs to several megabytes. Against our 138KB hero image that is a weight difference of roughly twenty to one, and unlike an image, a video requires continuous processing on the visitor’s device to decode and render each frame. The carbon cost does not land once on load; it accumulates for as long as the page is open. We cut it. The static image is what we actually built to.
The first performance pass was a failure, and a useful one. An early mobile test scored 67, dragged down by blocking scripts. Fixing that single issue moved it into the 90s. The number told us exactly where the waste was, which is the entire argument for measuring in the first place.
The scorecard
- CO2 per visit: 0.03g, measured 25 June 2026 on the live public site with the Sustainable Web Design model (version 4), the same model the Website Carbon Calculator uses. Target: under 0.1g, cleared with room to spare.
- PageSpeed, mobile: 98. Desktop: 100. Measured 25 June 2026 on the live public site with Lighthouse, the engine behind PageSpeed Insights. Target: 90+ on both, met.
- Cleaner than 95% of pages tested, rating A+, per the Website Carbon Calculator, measured 25 June 2026 on the live public site.
- Hosting: Krystal, 100% renewable energy, certified B Corp. Verifiable today, not on launch.
In development testing the build already met the performance target, scoring between 94 and 97 on mobile across repeated runs, with accessibility, best practices, and search engine optimisation (SEO) at 100. The carbon and performance figures above are measured on the live public site, including the Website Carbon “cleaner than” percentile, published the same way we would measure a client’s site: in public, on the same tool. We held our own front door to the standard we intend to work to. The scorecard is how you check whether we meant it.
Want to know your own site’s number? Run it through the Website Carbon Calculator. It takes about thirty seconds, and if the result surprises you, that is usually where the brief should start. If you would like help reading what it means for your stack, book a carbon check and we will walk through it with you.
Frequently asked questions
What is a good carbon figure for a website?
The average web page produces about 0.36g of CO2 per visit, according to the Website Carbon Calculator. Under 0.2g is strong, and the most efficient sites sit around 0.06 to 0.09g, so under 0.1g puts you among the best. The figure depends mostly on page weight and whether the host runs on renewable energy.
Does green hosting actually cut emissions, or just offset them?
It depends on the host. Renewable supply means the energy powering the servers is largely low-carbon at source. Offsets pay to compensate for emissions that still happen. They are different purchases, so it is worth checking which one a “carbon neutral” host is actually making.
Do I need a static site to be sustainable?
No. Static is one lever, not a requirement. It removes server-side work that many sites do not need, but some products genuinely need dynamic features. The point is to make dynamic behaviour earn its place rather than arrive by default.
How do I measure my own site’s footprint?
Run the URL through the Website Carbon Calculator for carbon per visit, and through PageSpeed Insights for performance. Both are free, take under a minute, and give you a baseline you can hold a redesign to.